
Top navigation skipped
Budget Drivers: The Forces Driving State SpendingSpending by Article
General Revenue-Related Funds (GRR)
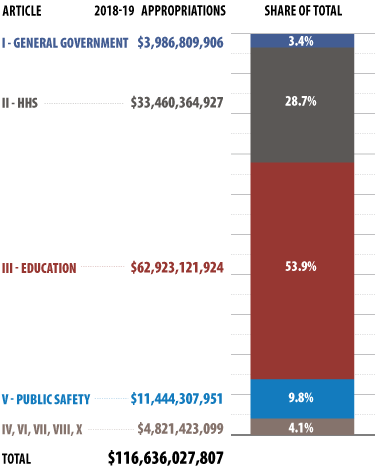
Texas appropriates very different amounts to each of the articles in the budget (Exhibit 3), spending the vast majority of all GRR resources on just two articles. Article III, which includes public and higher education, accounts for nearly 54 percent of general revenue-related funds appropriated for the 2018-19 biennium. Article II, health and human services, comes in second at nearly 29 percent.
Exhibit 3: GRR Appropriations for the 2018-19 Biennium, by Article
| Article | Appropriations | Share of Total (percent) |
|---|---|---|
| I - General Government | $3,986,809,906 | 3.4 |
| II - Health and Human Services | $33,460,364,927 | 28.7 |
| III - Education | $62,923,121,924 | 53.9 |
| V - Public Safety | $11,444,307,951 | 9.8 |
| IV, VI, VII, VIII, X | $4,821,423,099 | 4.1 |
| Total | $116,636,027,807 | 100.0 |
Note: Article IX consists of general provisions such as state employee salary schedules and does not involve costs. Totals may not add due to rounding.
Sources: Legislative Budget Board and Texas Comptroller of Public Accounts
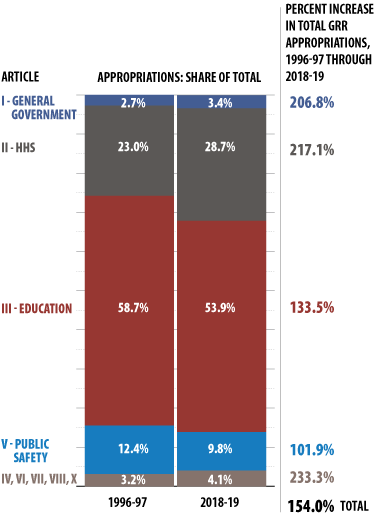
Exhibit 4: Change in GRR Appropriation Shares by Article, 1996-97 vs. 2018-19 Biennia
| Articles | 1996-97 Appropriations: Share of Total | 2018-19 Appropriations: Share of Total | Increase in Total GRR Appropriations, 1996-97 through 2018-19 |
|---|---|---|---|
| I - General Government | 2.7% | 3.3% | 206.8% |
| II - Health and Human Services | 23.0% | 28.7% | 217.1% |
| III - Education | 58.7% | 54.0% | 133.5% |
| V - Public Safety | 12.4% | 9.8% | 101.9% |
| IV, VI, VII, VIII, X | 3.2% | 4.1% | 233.3% |
| Total | 100.0% | 100.0% | 154.0% |
Note: Article IX consists of general provisions such as state employee salary schedules and does not involve costs. Totals may not add due to rounding.
Sources: Legislative Budget Board and Texas Comptroller of Public Accounts
The relative shares of funding devoted to each article have changed over time (Exhibit 4). Since the 1996-97 budget, health and human services have taken an increasing share of GRR, while education’s share has fallen. Health and human services appropriations rose by 217 percent during this period, while those for education rose by less than 134 percent, well below the increase in total GRR spending.
All Funds
For All Funds, the spending picture is different (Exhibit 5). For 2018-19, education’s share is substantially lower than for GRR (37.4 percent), while health care’s is a bit higher, as health care receives more federal dollars. Article VII, a negligible portion of GRR funding, accounts for nearly 15 percent of All-Funds spending, due largely to substantial amounts of federal and “other” funding for transportation.
Exhibit 5: All-Funds Appropriations for the 2018-19 Biennium, by Article
| Articles | 2018-19 Appropriations | Share of Total |
|---|---|---|
| I - General Government | $6,032,089,914 | 2.8% |
| II - Health and Human Services | $78,871,657,229 | 36.4% |
| III - Education | $81,051,118,003 | 37.4% |
| V - Public Safety | $12,305,654,059 | 5.7% |
| VII - Business/EconomicDevelopment | $31,841,630,980 | 14.7% |
| IV, VI, VIII, X | $6,348,205,678 | 2.9% |
| Total | $216,450,355,863 | 100.0% |
Note: Article IX consists of general provisions such as state employee salary schedules and does not involve costs. Totals may not add due to rounding.
Sources: Legislative Budget Board and Texas Comptroller of Public Accounts
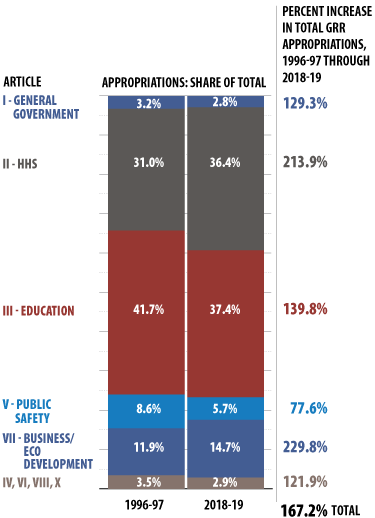
Exhibit 6: Change in All-Funds Appropriations by Article, 1996-97 vs. 2018-19 Biennia
| Article | 1996-97 Appropriations: Share of Total | 2018-19 Appropriations: Share of Total | Percent Increase in Total All-Funds Appropriations, 1996-97 through 2018-19 |
|---|---|---|---|
| I - General Government | 3.2% | 2.8% | 129.3% |
| II - Health and Human Services | 31.0% | 36.4% | 213.9% |
| III - Education | 41.7% | 37.4% | 139.8% |
| V - Public Safety | 8.6% | 5.7% | 77.6% |
| VII - Business/Economic Development | 11.9% | 14.7% | 229.8% |
| IV, VI, VIII, X | 3.5% | 2.9% | 121.9% |
| Total | 100.0% | 100.0% | 167.2% |
Note: Article IX consists of general provisions such as state employee salary schedules and does not involve costs. Totals may not add due to rounding.
Sources: Legislative Budget Board and Texas Comptroller of Public Accounts
As with GRR appropriations, health and human services have claimed a growing share of All-Funds spending in the last two decades, while education’s share has declined (Exhibit 6).
Measuring Growth with Indices
Comparisons made in this report examine growth since 1996. To highlight and compare the relative change in appropriations, revenues, population and personal income in this analysis, the relevant numbers have been indexed. That is, we assume the value 100 for the base year or biennium, with values in subsequent years or biennia showing change from this base. For example, assuming a base of 100 for fiscal 1996, an index of 255.5 for fiscal 2019 appropriations would mean 2.555 times as much spending as in the base year.
In addition to indices for appropriations, the following are used:
- a general cost index, which reflects growth in the price of goods and services as the product of population and the consumer price index, or CPI;
- an education cost index, which shows growth in the cost of education as the product of weighted average daily attendance and the federally determined State and Local Government Purchases deflator, a measure of price inflation in goods that governments typically buy;
- a higher education cost index, reflecting the growth in higher education costs as the product of total credit hours and the CPI;
- a net tuition and fees index which shows the growth in average tuition and fees per student at Texas public institutions from the base year of fiscal 1996;
- a highway construction cost index, which reflects growth in the cost of building and maintaining roads as the product of total vehicle miles traveled on Texas roads and the federally maintained price index for state and local investment in highways and streets;
- a medical cost index for Medicaid expenditures, which shows growth in the cost of health care as the product of the Medicaid caseload and the federally determined Medical Services Consumer Price Index;
- a personal income index, which shows growth in Texas personal income from the base year of fiscal 1996; and
- a taxable property values index, which shows growth in the total taxable value of Texas property from the base year of fiscal 1996.
Spending: The Big Three
While Texas appropriates money for a wide range of programs, in the last two decades three areas — health care, education and transportation — have framed virtually every budget debate. This is hardly surprising, given that the three articles dominated by these purposes, as seen in Exhibit 4, account for nearly 90 percent of all state spending.
Relentless growth in health care spending in particular, spurred by rising costs and caseloads, has taken an increasing share of available revenue.
Education spending has risen consistently as well, due to average student enrollment increases of nearly 73,000 or 1.6 percent annually, but local property taxes account for a growing share of this spending, reducing state appropriations under the state’s funding formulas. Widespread taxpayer discontent with rising property taxes prompted school finance reform in 2006 that put more state money into the school system and reduced property tax rates. Since then, however, Texas property values have continued to climb, driving up property tax collections. The state’s share of total funding has been declining steadily annually since 2008. Twelve years later, lawmakers once again are grappling with ideas for lowering property taxes.
Finally, in recent years Texas has dedicated more state revenue to transportation, sending significant portions of severance and sales tax collections to the State Highway Fund and thus reducing revenue available for other programs.