
Top navigation skipped
Comparison of Major Categories of Expenditure
Comparison of Major Categories of State Expenditures
Texas State Expenditures by County 2010
Major Spending Categories
The tables in this report list state expenditures in major categories that parallel those used in the 2010 Annual Cash Report.
Intergovernmental Payments include grants to colleges, schools and local governments; distribution of Foundation School Program funds to local school districts; textbooks for public schools; and allocations of mixed beverage taxes to cities and counties.
Labor Costs are salaries, wages, employee benefits payments, travel expenses and fees for professional consultant services. Also included is the state’s share of retirement contributions on behalf of state employees and public school teachers.
Public Assistance includes Temporary Assistance for Needy Families (TANF), Medicaid, grants in aid, child support payments and similar state services.
Highway Construction includes purchases of highway right-of-way and the expenses of constructing the state’s roads and bridges.
Operating Expenses are supplies, maintenance, utilities, rentals, leases, printing and non-capitalized equipment.
Capital Outlay expenditures include aircraft, computer equipment, land and buildings, major improvements to state property, motor vehicles and capitalized purchases of furniture and equipment.
Miscellaneous includes all other expenditures, such as court costs, fees, interest on debt, lottery payments and payment of claims and judgments.
Overview of Changes in Major Categories of Expenditure: 2000-2010
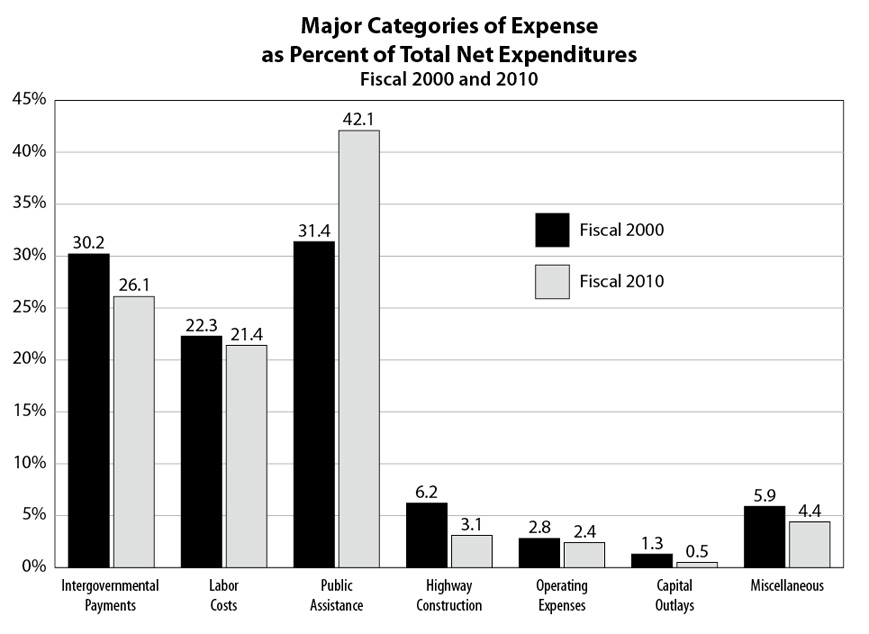
Since 2000, Texas state government expenditures by county grew from $52.2 billion in net expenditures to $107.9 billion in 2010, up 106.8 percent. During this time, the seven major categories of expenditure grew at different rates.
Public assistance expenditures led all expenditure categories, in dollars and percentage of total net expenditures in both fiscal 2000 and 2010. Those expenditures represented $16.4 billion of $52.2 billion (31.4 percent) in fiscal 2000, jumping 177.4 percent to $45.4 billion (42.1 percent) out of a total $107.9 billion in fiscal 2010.
Medical Services and Specialties ($15.4 billion) and unemployment payments ($7.9 billion) made up the bulk of these expenditures in fiscal 2010. The second largest category was intergovernmental payments, which comprised 26.1 percent (about $28.2 billion) of total expenditures. Labor costs were the third largest category ($23 billion), followed by miscellaneous ($4.7 billion) highway construction ($3.4 billion), operating expenses ($2.6 billion) and capital outlays ($577 million).
The tables and chart below illustrate the growth in expenditures by major category between 2000 and 2010.
Comparison of Major Categories of Expenditure
Amount, Percent Change and Rank by Percent Change
Fiscal 2000 and 2010
| Major Category of Expenditure | Fiscal 2000 | Fiscal 2010 | Percent Change FY 2000 to 2010 |
Rank by Percent Change FY 2000 to 2010 |
|---|---|---|---|---|
| Intergovernmental Payments | $15,743,032,218 | $28,195,490,435 | 79.1 | 3 |
| Labor Costs | 11,650,077,537 | 23,070,375,666 | 98.0 | 2 |
| Public Assistance | 16,371,606,627 | 45,407,089,305 | 177.4 | 1 |
| Highway Construction | 3,225,001,966 | 3,370,921,600 | 4.5 | 6 |
| Operating Expenses | 1,453,093,800 | 2,570,972,987 | 76.9 | 4 |
| Capital Outlays | 694,986,426 | 576,853,328 | (17.0) | 7 |
| Miscellaneous | 3,058,885,605 | 4,741,768,573 | 55.0 | 5 |
| Total Net State Expenditures by County | $52,196,684,179 | $107,933,471,894 | 106.8 |
Comparison of Major Categories of State Expenditures
by County as Percent of Total Net Expenditures
Fiscal 2000 and 2010
| Category of Expense | Fiscal 2000 | Percent of Net Expenditures Fiscal 2000 |
Fiscal 2010 | Percent of Net Expenditures Fiscal 2010 |
|---|---|---|---|---|
| Intergovernmental Payments | $15,743,032,218 | 30.2 | $28,195,490,435 | 26.1 |
| Labor Costs | 11,650,077,537 | 22.3 | 23,070,375,666 | 21.4 |
| Public Assistance | 16,371,606,627 | 31.4 | 45,407,089,305 | 42.1 |
| Highway Construction | 3,225,001,966 | 6.2 | 3,370,921,600 | 3.1 |
| Operating Expenses | 1,453,093,800 | 2.8 | 2,570,972,987 | 2.4 |
| Capital Outlays | 694,986,426 | 1.3 | 576,853,328 | 0.5 |
| Miscellaneous | 3,058,885,605 | 5.9 | 4,741,768,573 | 4.4 |
| Total Net Expenditures | $52,196,684,179 | $107,933,471,894 |
Changes Affecting State Agencies
Changes from the 81st Legislature affected a number of agencies. All activities and functions shared by the Commission on State Emergency Communications (Agency 477) and the Texas Department of State Health Services (537) connected with oversight of poison control networks and regional poison control centers were transferred to the Commission on State Emergency Communications (477).
The 81st Legislature created the Texas A&M-Central Texas (770) and the Texas A&M University-San Antonio (749) in 2010 once they received certification from the Texas Higher Education Coordinating Board verifying both institutions had reached required enrollment levels. The Office of Capital Writs (215) was also established.
The Incentive and Productivity Commission (353) was abolished. The Texas Residential Construction Commission (370) was also abolished because its sunset provision was not extended. The Texas Department of Criminal Justice (696) received the functions of the Private Sector Prison Industries Oversight Authority (645) which was abolished. The Board of Professional Tax Examiners (337) and the Polygraph Examiners Board (474) were abolished and functions of both agencies were transferred to the Texas Department of Licensing and Regulation (452).
The Texas Department of Banking (451), the Credit Union Department (469), the Office of Consumer Credit Commissioner (466) and the Department of Savings and Mortgage Lending (450) became self-directed and semi-independent agencies.
The 81st Legislature renamed the Office of Rural Community Affairs (357) the Texas Department of Rural Affairs. The Texas Department of Transportation (601) transferred the Automobile Burglary and Theft Prevention Authority, Motor Vehicle Division, Registration Division and Vehicle Titles Division to the Department of Motor Vehicles (608).
The University of North Texas (UNT) established the UNT at Dallas College of Law and the University of Texas System established the UT Health Science Center-South Texas.
Adjustments to the Uniform Statewide Accounting System
Most of the data in this report comes from the Uniform Statewide Accounting System (USAS). The Comptroller’s office uses USAS, a computerized accounting system, for controlling and reporting all expenditures for Texas state government. In several instances, inconsistencies between the accounting system’s requirements and the need for an accurate report of state expenditures by county required the Comptroller’s office to adjust the distribution of state expenditures to counties.
The Comptroller’s office takes expenditure data from USAS in the form of vouchers submitted by state agencies for payment of goods and services. Vouchers, which carry a citation of the legal authority for the payment, result in state checks or warrants — either an electronic transfer or a check – to the vendor of the goods or services. Vendors may be businesses, government entities, individuals or organizations.
The distribution of most state expenditures among the counties relies upon a computerized file with the name and mailing address of each vendor. Designed to track accounting transactions, USAS does not identify the location of expenditures. A vendor’s address might not accurately indicate where the purchased goods or services were delivered.
The Comptroller’s office makes adjustments to the underlying USAS data for large expenditure categories that, if not reallocated, would misrepresent the distribution of state funds to counties. With USAS, certain major expenditures, such as state employee benefit payments or public assistance, may appear to be made only in Travis County, since it is the headquarters for most state agencies. In this report, these payments, including expenditures for insurance, retirement contributions and Social Security, are adjusted.
The Comptroller’s office reallocates unemployment compensation benefits to former state employees and insurance payments for current employees based on a percentage of state employees in each county. Employee retirement and Social Security payments are allocated by a ratio of state employee salaries by county and by agency, using USAS data. State contributions to the Teacher Retirement System are allocated to counties based on where payments to retirees from the trust fund were made.
Each year, the Comptroller’s office uses information from selected state agencies to make adjustments to the data for this report. For fiscal 2010, the Attorney General’s office provided a list of the agency’s distribution of child support payments made to recipients in and out of the state. The Department of Aging and Disability Services provided data by county for payments made for long-term care nursing facilities and hospice care; Title XX Long Term Care/Non-Medicaid Services, and Intermediate Care Facilities/Mental Retardation. The Department of Criminal Justice provided a list of vendors for each state-operated facility with amounts paid to out-of-state vendors. The Comptroller’s office adjusted the Department of State Health Services’ payments for the Special Supplemental Food Program for Women, Infants and Children using a statewide distribution of the program’s client population. Data collected from the Health and Human Services Commission (HHSC), for Medicaid clients by county, was used to adjust fee-for-service and managed care Medicaid expenditures. Payment data by county for Temporary Assistance for Needy Families was provided by HHSC to make a proportional distribution by county. The Comptroller’s office collected expenditure data on textbooks for public schools from the Texas Education Agency. The Texas Department of Transportation provided information on highway construction, maintenance and right-of-way purchases to more accurately allocate expenditures to the county in which the construction was performed. The Veterans Land Board at the Texas General Land Office provided expenditure data on counties that received housing assistance and home improvement program funds.
The Texas Workforce Commission supplied fiscal 2010 unemployment insurance benefit data by county reflecting more than $3.9 billion in federal and almost $3.4 billion in state benefits for a total of more than $7.3 billion in unemployment insurance benefit payments paid in fiscal 2010.
Each year, the Texas Workforce Commission includes federal unemployment benefits in its data by county submission to the Comptroller’s office for this report. Before July 2008, federal benefits were typically modest and included natural disaster benefits, benefits due to employees laid off due a trade agreement and benefits for federal or military employees. Since July 1, 2008 when the economy began to slump, a number of laws were passed that expanded or otherwise extended federally funded unemployment benefits. The following federal laws affecting unemployment benefits paid by the Texas Workforce Commission in fiscal 2010 included:
- P.L. 110-252 (Supplemental Appropriations Act, 2008) signed on June 30, 2008, which established the Emergency Unemployment Compensation (EUC08) Program.
- The EUC08 program was expanded on Nov. 21, 2008 by P.L. 110-449 under the Unemployment Compensation Extension Act of 2008.
- The EUC08 program was extended on Feb. 17, 2009 by P.L. 111-5 (American Recovery and Reinvestment Act) and the Federal Additional Compensation (FAC) was initiated which added $25 per week to every unemployment check. Additionally, the EB program (state/federal extended benefits) was initiated as 100 percent federally funded.
- The EUC08 program and the EB program were expanded on Nov. 6, 2009 by P.L. 111-92 (Worker, Homeownership, and Business Assistance Act of 2009).
- The EUC08 program and the EB program were extended on Dec. 19, 2009 by P.L. 111-118 (Department of Defense Appropriations Act, 2010).
- The EUC08 program and the EB program were extended on March 2, 2010 by P.L. 111-144 (Temporary Extension Act of 2010).
- The EUC08 program and the EB program were extended on April 15, 2010 P.L. 111-157 (Continuing Extension Act of 2010).
- On July 22, 2010, the EUC08 program and the EB program were further extended by P.L. 111-205 (Unemployment Compensation Extension Act of 2010).
Expenditures not allocated to counties are moved to “Expenditures Unallocable to Texas Counties.” Transactions moved to this category in fiscal 2010 include expenditures for Object Codes 7001-7048, Salaries and Wages; Object Code 7206, Service Fee Paid to the Lottery Operator (GTech in Rhode Island, a subsidiary of Lottomatica in Rome, Italy); Object Code 7209, Lottery Winnings-Installment; Object Code 7245, Financial and Accounting Services; Object Code 7253, Other Professional Services; Object Code 7299, Purchased Contracted Services; Object Code 7312, Medical Supplies; Object Code 7641, Public Assistance-Temporary Assistance for Needy Families (TANF); Object Code 7662, Vendor Drug Program; Object Code 7664, Supplementary Medical Insurance Benefits and Object 7801, Interest on Governmental and Fiduciary Long-Term Debt. Unallocable state hospital expenditures are listed under Object code 7830, Disbursement of Disproportionate Share Funds to State Hospitals; and Object Code 7832, State Hospital Payments of State Matching Disproportionate Share Funds and Upper Payment Limit Funds to the Texas Department of Health.
In some cases, smaller objects of expenditure that have not been redistributed may be reflected in the county where payment was made, not in the county where the goods or services were delivered.
The objects of expenditure that comprise each of the major spending categories are these:
| INTERGOVERNMENTAL PAYMENTS | ||
|---|---|---|
| 2010 Expenditures | ||
| 7383 | Textbooks for Public Free Schools | $513,731,353 |
| 7601 | Grants-Elementary and Secondary Schools | 7,115,380,378 |
| 7602 | School Apportionment-Foundation Program | 16,293,092,453 |
| 7603 | Grants-Junior Colleges | 1,043,902,521 |
| 7604 | Grants-Senior Colleges and Universities | 112,317,545 |
| 7611 | Payments/Grants-Cities | 830,868,233 |
| 7612 | Payments/Grants-Counties | 982,915,179 |
| 7613 | Payments/Grants-Other Political Subdivisions | 631,459,580 |
| 7621 | Grants-Council of Governments | 285,247,128 |
| 7622 | Grants-Judicial Districts | 249,984,523 |
| 7683 | Allocations to Cities-Mixed Beverage Tax | 60,500,863 |
| 7684 | Allocation to Counties-Mixed Beverage Tax | 65,562,903 |
| 7688 | Allocation for International Fuels Tax Agreement (IFTA ) | 19,527,778 |
| TOTAL INTERGOVERNMENTAL PAYMENTS | $28,195,490,435 | |
| LABOR COSTS | ||
|---|---|---|
| 2010 Expenditures | ||
| Salaries and Wages | ||
| 7001 | Salaries and Wages-Line Item Exempt Positions | $104,195,207 |
| 7002 | Salaries and Wages-Classified and Non-Classified Permanent Full-Time Employees | 5,630,415,357 |
| 7003 | Salaries and Wages-Classified and Non-Classified Permanent Part-Time Employees | 49,940,433 |
| 7004 | Salaries and Wages-Classified and Non-Classified Non-Permanent Full-Time Employees | 25,139,300 |
| 7005 | Salaries and Wages-Classified and Non-Classified Non-Permanent Part-Time Employees | 5,750,872 |
| 7006 | Salaries and Wages-Hourly Full-Time Employees | 50,244,833 |
| 7007 | Salaries and Wages-Hourly Part-Time Employees | 7,060,857 |
| 7008 | Higher Education Salaries-Faculty/Academic Employees | 1,785,034,424 |
| 7009 | Higher Education Salaries-Faculty/Academic Equivalent Employees | 58,655,479 |
| 7010 | Higher Education Salaries-Professional/Administrative Employees | 819,988,492 |
| 7011 | Higher Education Salaries-Extension-Professional/Administrative Employees | 15,678,557 |
| 7014 | Higher Education Salaries-Student Employees | 194,881,083 |
| 7015 | Higher Education Salaries-Classified Employees | 1,007,094,525 |
| 7016 | Salaries and Wages-Classified Employees Receiving Twice-a-Month Salary Payment | 288,720,957 |
| 7017 | One-Time Merit Increase | 22,642,539 |
| 7018 | Hardship Stations Pay | 422,381 |
| 7019 | Compensatory Time Pay | 8,202,205 |
| 7020 | Hazardous Duty Pay | 51,243,562 |
| 7021 | Overtime Pay | 120,265,991 |
| 7022 | Longevity Pay | 163,201,758 |
| 7023 | Lump Sum Termination Payment | 53,526,060 |
| 7024 | Termination Pay-Death Benefits | 1,507,270 |
| 7025 | Compensatory or Salary Per Diem | 233,070 |
| 7028 | Productivity Bonus Awards | 467,439 |
| 7030 | Employee Incentive Bonus | 0 |
| 7031 | Emoluments and Allowances | 38,148,686 |
| 7035 | Stipend Pay | 6,389,503 |
| 7037 | Incentive Award for Authorized Service to Veterans | 106,118 |
| 7047 | Recruitment and Retention Bonuses | 2,971,463 |
| 7050 | Benefit Replacement Pay | 41,079,998 |
| TOTAL SALARIES AND WAGES | 10,553,208,417 | |
| Employee Benefits | ||
| 7032 | Employees Retirement-State Contribution | 432,955,298 |
| 7033 | Employee Retirement-Other Employment Expenses | 136,413 |
| 7041 | Employee Insurance Payments-(Employer Contribution) | 1,882,694,564 |
| 7043 | F.I.C.A. Employer Matching Contribution | 765,892,178 |
| 7048 | Performance Rewards | 100,109 |
| 7052 | Unemployment Compensation Benefits-Special Fund Reimbursement | 34,966,581 |
| 7061 | Workers' Compensation Claims-Self Insurance Programs | 3,438,713 |
| 7062 | Workers' Compensation-Indemnity Payments | 16,546,809 |
| 7082 | Retirement/Benefits Payments-Judicial Retirement System | 27,298,519 |
| 7086 | Optional Retirement-State Match | 159,767,848 |
| 7092 | Ranger Pensions | 200 |
| 7231 | Workers' Compensation-Medical Services and Attorney Payments | 26,727,448 |
| 7232 | Workers' Compensation Self Insurance Programs-Medical Services and Attorney Payments | 3,335,036 |
| 7233 | Employee Benefit Payments | 4,853,375,809 |
| 7917 | Allocations from Fund 0001 to TRS Trust Account 0960, Retired School Employee GIP Trust 0989, and GR Account-Excess Benefit Arrangement, TRS 5031 (Dedicated Receipts) | 1,908,605,204 |
| TOTAL EMPLOYEE BENEFITS | 10,115,840,729 | |
| Travel | ||
| 7101 | Travel In-State-Public Transportation Fares | 17,189,042 |
| 7102 | Travel In-State-Mileage | 66,450,753 |
| 7103 | Travel-Per Diem, Non-Overnight Travel-Legislature | 201,907 |
| 7104 | Travel In-State-Actual Meal and Lodging Expenses-Overnight Travel | 314,238 |
| 7105 | Travel In-State-Incidental Expenses | 6,989,898 |
| 7106 | Travel In-State-Meals and Lodging | 47,807,178 |
| 7107 | Travel In-State-Non-Overnight Travel (Meals) | 859,227 |
| 7108 | Travel In-State-Actual Expense Meals-No Overnight Travel | 41,663 |
| 7110 | Travel In-State-Board or Commission Member Meal and Lodging Expenses | 876,356 |
| 7111 | Travel Out-of-State-Public Transportation Fares | 5,340,178 |
| 7112 | Travel Out-of-State-Mileage | 405,708 |
| 7113 | Travel-Per Diem, Overnight Travel-Legislature | 986,053 |
| 7114 | Travel Out-of-State-Actual Meal and Lodging Expenses, Overnight Travel | 500,624 |
| 7115 | Travel Out-of-State-Incidental Expenses | 1,090,801 |
| 7116 | Travel Out-of-State-Meals and Lodging Not to Exceed the Locality-Based Allowance | 5,111,413 |
| 7117 | Travel Out-of-State-Non-Overnight Travel (Meals) | 1,018 |
| 7118 | Travel Out-of-State-Actual Expense Meals-No Overnight Travel | 176 |
| 7121 | Travel-Foreign | 943,179 |
| 7122 | Travel In-State-Single-Engine Aircraft Mileage | 23,300 |
| 7123 | Travel Out-of-State-Single-Engine Aircraft Mileage | 601 |
| 7124 | Travel In-State-Twin-Engine Aircraft Mileage | 32,470 |
| 7125 | Travel Out-of-State-Twin-Engine Aircraft Mileage | 901 |
| 7126 | Travel In-State-Turbine-Powered or Other Aircraft Mileage | 13,018 |
| 7127 | Travel Out-of-State-Turbine-Powered or Other Aircraft Mileage | 4,545 |
| 7128 | Travel-Apartment/House Rental Expense | 54,795 |
| 7130 | Travel Out-of-State-Board or Commission Member Meal and Lodging Expenses | 47,832 |
| 7131 | Travel-Prospective State Employees | 341,361 |
| 7134 | Legislative Per Diem | 9,192 |
| 7135 | Travel In-State-State Hotel Occupancy Tax Expense Outside Galveston, Port Aransas and South Padre Island City Limits | 47,253 |
| 7136 | Travel In-State-State Hotel Occupancy Tax Expense Inside Galveston City Limits | 1,326 |
| 7137 | Travel In-State-State Hotel Tax Expense Inside South Padre Island City Limits | 566 |
| 7138 | Travel In-State-State Hotel Tax Expense Inside Port Aransas City Limits | (1,023) |
| TOTAL TRAVEL | 155,685,547 | |
| Professional Fees and Services | ||
| 7238 | Foreign Office Activities | 328,627 |
| 7239 | Consultant Services-Approval by Office of the Governor | 8,746,135 |
| 7240 | Consultant Services-Other | 19,975,878 |
| 7242 | Consulting Services-Information Technology (Computer) | 8,469,031 |
| 7243 | Educational/Training Services | 20,048,699 |
| 7245 | Financial and Accounting Services | 173,309,286 |
| 7246 | Legal Services | 8,851,264 |
| 7247 | Hearings Officers-Pre-approved by the State Office of Administrative Hearings | 29,580 |
| 7248 | Medical Services | 548,566,667 |
| 7249 | Veterinary Services | 660,540 |
| 7252 | Lecturers-Higher Education | 1,765,146 |
| 7253 | Other Professional Services | 964,549,225 |
| 7254 | Other Witness Fees | 4,576,843 |
| 7255 | Investment Counseling Services | 18,398,595 |
| 7256 | Architectural/Engineering Services | 268,260,106 |
| 7257 | Legal Services-Approval by the State Office of Administrative Hearings | 67,234 |
| 7258 | Legal Services-Other | 5,625,826 |
| 7275 | Information Technology Services | 193,412,292 |
| 7396 | TxDOT Toll Road Expense-Preliminary Engineering | 0 |
| TOTAL PROFESSIONAL FEES AND SERVICES | 2,245,640,973 | |
| TOTAL LABOR COSTS | $23,070,375,666 | |
| PUBLIC ASSISTANCE PROGRAMS | ||
|---|---|---|
| 2010 Expenditures | ||
| 7214 | Public Assistance Payments-Unemployment | $7,883,534,781 |
| 7215 | Return of Retirement Contributions | 329,923,689 |
| 7623 | Grants-Community Service | 2,840,544,143 |
| 7624 | Grants-Individuals | 3,746,372 |
| 7640 | Public Assistance-Child Support Payments, Non-Title IV-D | 825,090,839 |
| 7641 | Public Assistance-Temporary Assistance for Needy Families (TANF) | 111,090,244 |
| 7642 | Public Assistance-Child Support Payments, Title IV-D | 2,883,804,787 |
| 7643 | Other Financial Services | 86,731,203 |
| 7644 | Commodity Distribution Program | 323,536,081 |
| 7645 | Disaster Relief Payments | 1,903,309 |
| 7651 | Financial Services-Discharged Convicts | 3,607,550 |
| 7652 | Financial Services-Rehabilitation Clients | 227,759,604 |
| 7661 | Medical Services-Nursing Home Programs | 4,538,826,929 |
| 7662 | Vendor Drug Program | 2,391,934,951 |
| 7664 | Supplementary Medical Insurance Benefits | 926,928,010 |
| 7666 | Medical Services and Specialties | 15,429,676,330 |
| 7671 | Grants-in-Aid (Day Care) | 3,835 |
| 7672 | Grants-in-Aid (Foster Care) | 544,615,876 |
| 7673 | Grants-in-Aid (Care for Aged, Blind and Disabled) | 90,056,006 |
| 7674 | Grants-in-Aid (Services for Children/Clients) | 204,628,646 |
| 7676 | Grants-in-Aid (Transportation) | 187,940,529 |
| 7677 | Family Planning Services | 118,716,710 |
| 7678 | Employment Social Services | 89,239 |
| 7679 | Grants-College/Vocational Students | 175,858,011 |
| 7680 | Grants-in-Aid (Food) | 569,975,732 |
| 7681 | Grants-Survivors | 13,324,508 |
| 7829 | Disburse Medicaid Incentive Transfers to State Hospitals (UPL) | 67,472,460 |
| 7830 | Disbursement of Disproportionate Share Funds/State Hospitals | 337,695,016 |
| 7831 | Disbursement of Disproportionate Share Funds/Non-State Hospitals | 1,276,158,450 |
| 7832 | State Hospital Payments of State Matching Disproportionate Share and Upper Payment Limit (UPL) Funds | 408,195,075 |
| 7835 | Disbursement Medicaid Incentive Transfers to Urban/Rural Hospitals (UPL) | 2,603,720,389 |
| TOTAL PUBLIC ASSISTANCE PAYMENTS | $45,407,089,305 | |