
Top navigation skipped
Construction Overview Women in the Workforce
Construction Snapshot | Printable Construction Snapshot (PDF)
The construction sector builds, alters and maintains residential and nonresidential buildings and infrastructure. From 2007 to 2010, construction lost a sizable number of jobs and many of them did not return after the recession. In 2016, construction contributed 91.2 billion dollars to Texas’ economy. Women account for 19 percent of the state’s 726,000 jobs in this sector.
Quick Facts
- Construction contributed 91.2 billion dollars to Texas’ gross state product in 2016, more than 5 percent of the total.
- The sector had nearly 726,000 jobs in 2017, 6 percent of all Texas jobs.
- Specialty trade contractors had the largest share of jobs in the sector in 2017, with nearly 57 percent.
- Between 2010 and 2017, the sector added nearly 141,000 positions, with the most growth in specialty trade contractors (more than 77,000).
Average regional multipliers for construction sector were used to estimate how an initial economic input in the sector, in the form of sales, jobs or earnings, affect the greater Texas economy. These multipliers capture “indirect” effects on industries that supply goods and services to the sector as well as “induced” effects on industries that sell local goods and services — such as housing, food or entertainment — to workers in the construction sector and its suppliers (Exhibit 1).1
Exhibit 1: Average Type 2 Multipliers for Construction
Jobs*
- Average Multiplier: 2.19
- For every 100 jobs created, an additional 119 jobs are supported in all other industries within the Texas economy.
Sales
- Average Multiplier: 2.22
- For every $1 million in sales, an additional 1.22 million dollars in sales are generated by other industries within the Texas economy.
Earnings
- Average Multiplier: 2.06
- For every $1 million in earnings generated, an additional 1.06 million dollars in earnings are generated by other industries within the Texas economy.
*The multiplier effect in this analysis is applicable to any worker in this industry and does not differentiate effects by gender.
Sources: Emsi and Texas Comptroller of Public Accounts
Texas Women in Construction
In 2017, women held nearly 136,000 jobs in construction (Exhibit 2). Those jobs generate additional business activities that ultimately support about 162,000 jobs in all other industries of the Texas economy.2
| Description | NAICS Code* | Total Jobs | 2010 to 2017 Change | Average Earnings Per Job** | Women's Jobs | Women’s Share of Jobs | Location Quotient (Women)*** |
|---|---|---|---|---|---|---|---|
| Construction of Buildings | 236 | 164,869 | 28,457 | $91,486 | 34,240 | 21% | 1.06 |
| Heavy and Civil Engineering Construction | 237 | 150,003 | 35,164 | $81,588 | 23,579 | 16% | 1.19 |
| Specialty Trade Contractors | 238 | 411,038 | 77,010 | $63,549 | 77,990 | 19% | 1.21 |
| Construction, Total | 23 | 725,910 | 140,631 | $73,621 | 135,808 | 19% | 1.15 |
*The North American Industry Classification System (NAICS) is the federal system used to classify business establishments for statistical purposes.
**Based on total jobs in the industry including both genders. Earnings include salaries, wages, benefits and other compensation.
***Location quotient (LQ) indicates the relative concentration of women in these jobs in Texas versus in the nation as a whole.
Source: Emsi
Women accounted for 21 percent of all Texas jobs in the construction of buildings — the highest employment share among construction’s subsectors. Women held the highest number of jobs in specialty trade contractors (77,990).
Based on location quotient (LQ), a measure of employment concentration in a given area, the concentration of Texas women in construction jobs was higher than the national concentration in 2017. Within the sector, women working in the specialty trade contractor subsector are the most concentrated in Texas, with an LQ of 1.21.
Exhibit 3 lists the top occupations employed in construction by number of jobs. Although women account for 16 percent of all jobs in construction, they hold relatively smaller shares of employment within the sector’s top occupations, which are all mostly production-oriented.
Women in construction most commonly work in professional and administrative occupations, such as accountants and office clerks.
| Description | Jobs in Sector | Total Jobs (All Sectors)* |
Women's Share of Total Jobs |
|---|---|---|---|
| Construction Laborers | 90,811 | 103,058 | 6% |
| First-Line Supervisors of Construction Trades and Extraction Workers | 52,649 | 69,487 | 5% |
| Electricians | 47,475 | 59,343 | 3% |
| Plumbers, Pipefitters and Steamfitters | 35,573 | 41,938 | 2% |
| Carpenters | 35,222 | 39,226 | 3% |
*Other sectors employ workers with this occupation. This is a total for the occupation across sectors.
Source: Emsi
Earnings Growth
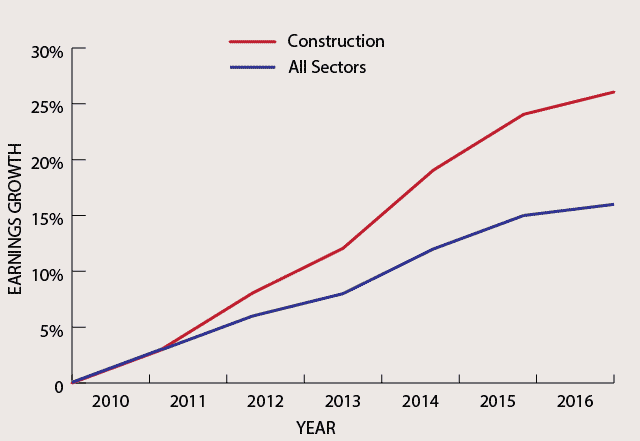
In 2016, women in construction earned $4,102 per month on average, up 26 percent from 2010 (Exhibit 4). Construction worker earnings often vary from month to month, due to the cyclical and seasonal nature of the sector and many of its occupations.
Exhibit 4: Growth in Average Monthly Earnings of Texas Women in Construction (Indexed from 2010)
| Sector | 2010 | 2011 | 2012 | 2013 | 2014 | 2015 | 2016 |
|---|---|---|---|---|---|---|---|
| Construction | 0% | 3% | 8% | 12% | 19% | 24% | 26% |
| All Sectors | 0% | 3% | 6% | 8% | 12% | 15% | 16% |
Source: U.S. Census Bureau Quarterly Workforce Indicators
Conclusion
Of all sectors of the Texas economy, construction has the lowest share of jobs held by women, although their concentration in these jobs is higher in Texas than in the nation. Texas women working in construction generate additional business activities that ultimately support about 162,000 jobs in all other industries of the state economy.
End Notes
The multipliers used in this analysis are averages of the Emsi Input-Output Model’s regional Type 2 earnings, sales and jobs multipliers for all six-digit NAICS categories within the construction sector. The Comptroller’s office acknowledges that averaging multipliers introduces aggregation bias. This is a general approximation of multiplier effects on the construction sector. For a more precise analysis of multiplier effects, analyze each six-digit NAICS category in the sector and its respective multipliers.
A direct effect is directly related to the production of the good or service of the industry in question. Indirect effects are generated in the businesses that supply goods and services to the industry that aid in the production of the good or service. Spending directly and indirectly generated incomes in the broader economy in turn creates induced effects.
Using the construction sector in an example, direct jobs would include workers in construction. The jobs of a lumber wholesaler that supplies the construction sector are indirect jobs. The jobs of restaurant workers that serve lunch to construction and lumber wholesaler workers are induced.
- The Type 2 jobs multiplier effect mentioned is based solely on the number of jobs held by women.