
Top navigation skipped
Leisure and Hospitality Overview Women in the Workforce
Leisure and Hospitality Snapshot | Printable Leisure and Hospitality Snapshot (PDF)
The leisure and hospitality industry, sometimes called a “super sector,” comprises two distinct sectors — arts, entertainment and recreation and accommodation and food services — both of them heavily driven by trends in consumer spending. In 2016, leisure and hospitality contributed $57.9 billion to Texas’ gross state product (GSP). Women account for 51 percent of the state’s 1.3 million jobs in this industry.
Quick Facts
- Leisure and hospitality contributed $57.9 billion to Texas GSP in 2016, nearly 4 percent of the total.
- Accommodation and food services accounted for the largest share of GSP, at $47.4 billion.
- Accommodation and food services provided 89 percent of all jobs in the industry.
- The industry contributed more than 1.3 million Texas jobs in 2017, 10 percent of all Texas employment.
- Between 2010 and 2017, the industry added more than 296,000 positions, most of them in accommodation and food services (nearly 269,000 jobs).
Average regional multipliers for leisure and hospitality were used to estimate how an initial introduction of economic input in the industry, in the form of sales, jobs or earnings, affect the greater Texas economy. These multipliers capture “indirect” effects on industries that supply goods and services to the industry as well as “induced” effects on industries that sell local goods and services — such as housing, food or entertainment — to workers in the leisure and hospitality industry and its suppliers (Exhibit 1).1
Exhibit 1: Average Type 2 Multipliers for Leisure and Hospitality
| Sector/Subsector | Sales | Jobs* | Earnings |
|---|---|---|---|
| Leisure and Hospitality | 2.33 | 1.8 | 2.31 |
| Arts, Entertainment and Recreation | 2.38 | 1.91 | 2.43 |
| Accommodation and Food Services | 2.25 | 1.6 | 2.12 |
The overall multiplier effects are as follows:
- Jobs
- For every 100 jobs created, an additional 80 jobs are supported in all other industries within the Texas economy.
- Sales
- For every $1 million in sales, an additional $1.33 million in sales are generated by other industries within the Texas economy.
- Earnings
- For every $1 million in earnings generated, an additional $1.13 million in earnings are generated by other industries within the Texas economy.
*The multiplier effect in this analysis is applicable to any worker in this industry and does not differentiate effects by gender.
Sources: Emsi and Texas Comptroller of Public Accounts
Texas Women in Leisure and Hospitality
In 2017, women held more than 670,000 jobs in leisure and hospitality (Exhibit 2). Those jobs generate additional business activities that ultimately support about 530,000 jobs in all other industries of the Texas economy. 2
| Description | NAICS Code* | Total Jobs | 2010 to 2017 Change | Average Earnings Per Job** | Women's Jobs | Women’s Share of Jobs |
|---|---|---|---|---|---|---|
| Arts, Entertainment and Recreation | 71 | 137,303 | 27,679 | $39,657 | 65,134 | 47% |
| Performing Arts, Spectator Sports and Related Industries | 711 | 28,262 | 5,036 | $90,974 | 11,691 | 41% | Museums, Historical Sites and Similar Institutions | 712 | 10,906 | 2,496 | $37,472 | 6,518 | 60% | Amusement, Gambling and Recreation Industries | 713 | 98,135 | 20,147 | $25,122 | 46,924 | 48% |
| Accommodation and Food Services | 72 | 1,165,315 | 268,685 | $22,155 | 605,033 | 52% |
| Accommodation | 721 | 121,405 | 20,792 | $31,658 | 69,111 | 57% | Food Services and Drinking Places | 722 | 1,043,910 | 247,893 | $21,050 | 535,922 | 51% |
| Leisure and Hospitality | 71-72 | 1,302,618 | 296,364 | $24,000 | 670,167 | 51% |
*The North American Industry Classification System (NAICS) is the federal system used to classify business establishments for statistical purposes.
**Based on total jobs in the industry including both genders. Earnings include salaries, wages, benefits and other compensation.
Source: Emsi
Arts, Entertainment and Recreation
In 2017, of all Texas women working in arts, entertainment and recreation, 72 percent (46,924) worked in the amusement, gambling and recreation industries subsector. Women had the highest share of total employment in museums, historical sites and similar institutions, with 60 percent of all Texas jobs in the subsector.
Exhibit 3 lists the top occupations in the arts, entertainment and recreation sector by number of jobs within the sector. Women account for more than half of all fitness trainers and aerobics instructors, the occupation with the second-highest employment in the sector.
| Description | Jobs in Sector | Total Jobs (All Sectors)* |
Women's Share of Total Jobs |
|---|---|---|---|
| Amusement and Recreation Attendants | 13,886 | 19,698 | 41% |
| Fitness Trainers and Aerobics Instructors | 10,500 | 15,599 | 57% |
| Landscaping and Grounds Keeping Workers | 6,954 | 69,633 | 13% |
*Other sectors employ workers with this occupation. This is a total for the occupation across sectors.
Source: Emsi
Accommodation and Food Services
The accommodation and food services sector, which produces most of the jobs in this industry, provides lodging and prepares meals, snacks and beverages for human consumption.
In 2017, women held 605,033 of Texas jobs in the sector, about 52 percent of the total. Women held the highest number of jobs in food services and drinking places (535,922), accounting for 51 percent of total jobs. Women held the highest share of jobs (57 percent) in the accommodation subsector.
Women held significant shares of jobs in accommodation and food services’ top two occupations, accounting for 61 percent of food preparation and serving workers and 67 percent of waiters and waitresses (Exhibit 4).
| Description | Jobs in Sector | Total Jobs (All Sectors)* |
Women's Share of Total Jobs |
|---|---|---|---|
| Combined Food Preparation and Serving Workers, Including Fast Food | 294,531 | 335,375 | 61% |
| Waiters and Waitresses | 207,770 | 220,309 | 67% |
| Cooks, Restaurant | 98,087 | 102,743 | 32% |
*Other sectors employ workers with this occupation. This is a total for the occupation across sectors.
Source: Emsi
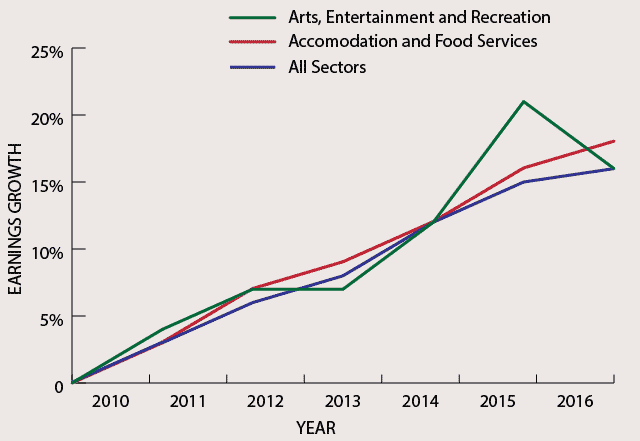
Earnings Growth
Of all sectors of the Texas economy, women earn the least per month in the two sectors within the leisure and hospitality industry. It’s important to note, however, that many employed in the leisure and hospitality industry generate a portion of their earnings through tips, which are self-reported and often understated.
From 2010 to 2016, the average monthly earnings of women increased in both sectors of leisure and hospitality. Women working in accommodation and foods services saw their earnings increase the most, by 18 percent — slightly more than the 16 percent earnings growth for women in arts, entertainment and recreation (Exhibit 5).
In 2016, Texas women in arts, entertainment and recreation and accommodation and food services earned an average of $2,054 and $1,628 per month, respectively.
Exhibit 5: Growth in Average Monthly Earnings of Texas Women in Leisure and Hospitality (Indexed from 2010)
| Sector | 2010 | 2011 | 2012 | 2013 | 2014 | 2015 | 2016 |
|---|---|---|---|---|---|---|---|
| Arts, Entertainment and Recreation | 0% | 4% | 7% | 7% | 12% | 21% | 16% |
| Accommodation and Food Services | 0% | 3% | 7% | 9% | 12% | 16% | 18% |
| All Sectors | 0% | 3% | 6% | 8% | 12% | 15% | 16% |
Source: U.S. Census Bureau Quarterly Workforce Indicators
Conclusion
Despite being one of Texas’ lowest-paying industries, leisure and hospitality is an important indicator of the strength of the state economy. Since 2010, Texas has added more than 296,000 jobs to reflect the increased free time and disposable income of state consumers post recession. Women play a significant role in the industry and are well represented in its largest occupations. Texas women in leisure and hospitality generate additional business activities that ultimately support about 530,000 jobs in other industries throughout the state economy.
End Notes
-
The multipliers used in this analysis are averages of the Emsi Input-Output Model’s regional Type 2 earnings, sales and jobs multipliers for all six-digit NAICS categories within this industry. The Comptroller’s office acknowledges that averaging multipliers introduces aggregation bias. This is a general approximation of multiplier effects on this sector. For a more precise analysis of multiplier effects, analyze each six-digit NAICS category in the sector and its respective multipliers.
A direct effect is directly related to the production of the good or service of the industry in question. Indirect effects are generated in the businesses that supply goods and services to the industry that aid in the production of the good or service. Spending directly and indirectly generated incomes in the broader economy in turn creates induced effects.
Using the accommodation subsector in an example, direct jobs would include the number of workers in accommodation. The jobs of a furniture wholesaler that supplies the accommodation sector are indirect jobs. The jobs of restaurant workers that serve accommodation and furniture wholesaler workers lunch are induced.
- The Type 2 jobs multiplier effect mentioned is based solely on the number of jobs held by women.