
Top navigation skipped
Financial Activities Overview Women in the Workforce
Financial Activities Snapshot | Printable Financial Activities Snapshot (PDF)
The financial activities industry, sometimes called a “super sector,” comprises two distinct sectors: finance and insurance and real estate and rental and leasing. Both have faced a host of opportunities and challenges due to changing technologies and the regulatory environment. In 2016, financial activities contributed $243.4 billion to Texas’ gross domestic product (GDP). Women account for 56 percent of the state’s 740,000 jobs in this industry.
Quick Facts
- Financial activities contributed $243.4 billion to state GDP in 2016, more than 15 percent of the total state GDP.
- Real estate and rental and leasing accounted for the largest share of GDP — $154.0 billion.
- The industry provided more than 740,000 Texas jobs in 2017, 6 percent of all Texas employment.
- Finance and insurance had the largest share of jobs in the industry, at 72 percent.
- Between 2010 and 2017, the industry added nearly 116,000 positions, with the most growth in finance and insurance (more than 78,000 jobs).
Average regional multipliers for financial activities were used to estimate how an initial introduction of economic input in the industry, in the form of sales, jobs or earnings, affects the greater Texas economy. These multipliers capture “indirect” effects on industries that supply goods and services to the industry as well as “induced” effects on industries that sell local goods and services — such as housing, food or entertainment — to workers in the financial activities industry and its suppliers (Exhibit 1).1
Exhibit 1: Average Type 2 Multipliers for Financial Activities
| Sector/Subsector | Sales | Jobs* | Earnings |
|---|---|---|---|
| Financial Activities | 2.44 | 4.51 | 3.20 |
| Finance and Insurance | 2.46 | 3.93 | 2.61 |
| Real Estate and Rental and Leasing | 2.41 | 5.50 | 4.21 |
The overall multiplier effects are as follows:
- Jobs
- For every 100 jobs created, an additional 351 jobs are created or affected in all other industries within the Texas economy.
- Sales
- For every $1 million in sales, an additional $1.44 million in sales are generated by other industries within the Texas economy.
- Earnings
- For every $1 million in earnings generated, an additional $2.20 million in earnings are generated by other industries within the Texas economy.
*The multiplier effect in this analysis is applicable to any worker in this industry and does not differentiate effects by gender.
Sources: Emsi and Texas Comptroller of Public Accounts
Texas Women in Financial Activities
In 2017, women held nearly 416,000 jobs in financial activities (Exhibit 2). Those jobs generate additional business activities that ultimately support about 1.5 million jobs in all other industries of the Texas economy. 2
| Description | NAICS Code* | Total Jobs | 2010 to 2017 Change | Average Earnings Per Job** | Women's Jobs | Women’s Share of Jobs |
|---|---|---|---|---|---|---|
| Finance and Insurance | 52 | 529,619 | 78,383 | $102,155 | 324,568 | 61% |
| Monetary Authorities - Central Bank | 521 | 1,457 | -296 | $118,025 | 594 | 41% |
| Credit Intermediation and Related Activities | 522 | 258,445 | 20,667 | $88,751 | 162,608 | 63% |
| Securities, Commodity Contracts and Other Financial Investments and Related Activities | 523 | 67,050 | 19,028 | $188,393 | 32,394 | 48% |
| Insurance Carriers and Related Activities | 524 | 201,802 | 45,935 | $89,975 | 128,580 | 64% |
| Funds, Trusts and Other Financial Vehicles | 525 | 865 | -6,951 | $237,351 | 392 | 45% |
| Real Estate and Rental and Leasing | 53 | 210,631 | 37,533 | $68,950 | 91,153 | 43% |
| Real Estate | 531 | 146,415 | 26,725 | $69,570 | 74,289 | 51% |
| Rental and Leasing Services | 532 | 61,987 | 10,748 | $65,709 | 15,883 | 26% |
| Lessors of Nonfinancial Intangible Assets (except Copyrighted Works) | 533 | 2,229 | 60 | $118,403 | 981 | 44% |
| Financial Activities, Total | 52, 53 | 740,250 | 115,916 | $92,707 | 415,720 | 56% |
*The North American Industry Classification System (NAICS) is the federal system used to classify business establishments for statistical purposes.
**Based on total jobs in the industry including both genders. Earnings include salaries, wages, benefits and other compensation.
Source: Emsi
Finance and Insurance
The finance and insurance sector primarily raises funds through deposits and issuance of securities, underwrites insurance or annuities and provides financial intermediation and employee benefit programs. This sector supplied the majority of the industry’s employment in 2017.
Women had the highest share of total employment in insurance carriers and related activities, with 64 percent of all Texas jobs in the subsector — slightly higher than credit intermediation and related activities (63 percent).
Exhibit 3lists the top occupations employed in finance and insurance based on the number of jobs in the sector. Though women account for more than half of three of the sector’s top five occupations, they dominate two occupations, tellers and insurance claims and policy processing clerks, in which they accounted for 86 percent and 82 percent of all 2017 jobs, respectively.
| Description | Jobs in Sector | Total Jobs (All Sectors)* |
Women's Share of Total Jobs |
|---|---|---|---|
| Customer Service Representatives | 51,828 | 260,763 | 67% |
| Tellers | 48,871 | 49,446 | 86% |
| Insurance Sales Agents | 42,423 | 43,214 | 56% |
| Securities, Commodities and Financial Services Sales Agents | 33,682 | 35,477 | 32% |
| Insurance Claims and Policy Processing Clerks | 30,892 | 34,919 | 82% |
*Other sectors employ workers with this occupation. This is a total for the occupation across sectors.
Source: Emsi
Real Estate and Rental and Leasing
In 2017, women held 91,153 jobs in the real estate and rental and leasing sector, which primarily engages in and provides services related to renting, leasing and purchasing tangible or intangible assets.
Women held the highest number of jobs (74,289) and the highest share of jobs (51 percent) in the real estate subsector. Women held more than half of all jobs of the sector’s top occupations. While women only account for only 3 percent of the sector’s top occupation — maintenance and repair workers — they account for more than half the remaining top occupations, most notably office clerks (82 percent) (Exhibit 4).
| Description | Jobs in Sector | Total Jobs (All Sectors)* |
Women's Share of Total Jobs |
|---|---|---|---|
| Maintenance and Repair Workers, General | 30,303 | 121,927 | 3% |
| Counter and Rental Clerks | 24,974 | 47,151 | 52% |
| Office Clerks, General | 15,479 | 388,682 | 82% |
| Real Estate Sales Agents | 13,899 | 17,719 | 58% |
| Property, Real Estate and Community Association Managers | 9,252 | 11,939 | 59% |
*Other sectors employ workers with this occupation. This is a total for the occupation across sectors.
Source: Emsi
Earnings Growth
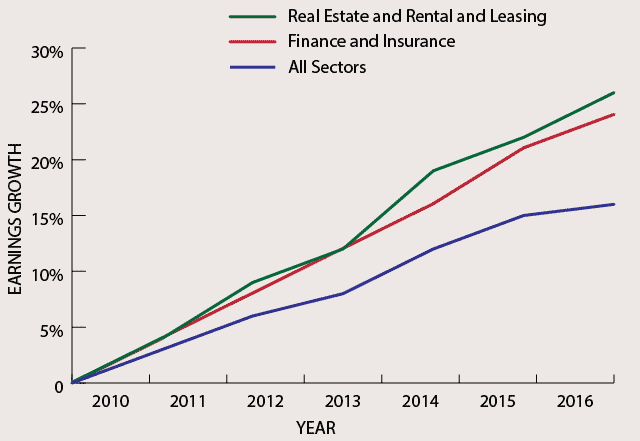
From 2010 to 2016, average monthly earnings of women in both finance and insurance and real estate and rental and leasing increased more than the average earnings of all women. Real estate and rental and leasing increased slightly more – by 26 percent (Exhibit 5). However, women in finance and insurance earned more per month in 2016 ($5,086).
Exhibit 5: Growth in Average Monthly Earnings of Texas Women in Financial Activities (Indexed from 2010)
| Sector | 2010 | 2011 | 2012 | 2013 | 2014 | 2015 | 2016 |
|---|---|---|---|---|---|---|---|
| Finance and Insurance | 0% | 4% | 8% | 12% | 16% | 21% | 24% |
| Real Estate and Rental and Leasing | 0% | 4% | 9% | 12% | 19% | 22% | 26% |
| All Sectors | 0% | 3% | 6% | 8% | 12% | 15% | 16% |
Source: U.S. Census Bureau Quarterly Workforce Indicators
Conclusion
The financial activities industry represents two large, dynamic sectors that generally grow in line with the wider economy. The industry continues to operate as an important employer in Texas, contributing the highest share of economic income despite having low employment relative to other industries. Texas women working in financial activities generate additional business activities that ultimately support about 416,000 jobs in other industries throughout the state economy.
End Notes
-
The multipliers used in this analysis are averages of the Emsi Input-Output Model’s regional Type II earnings, sales and jobs multipliers for all six-digit NAICS categories within the financial activities industry. The Comptroller’s office acknowledges that averaging multipliers introduces aggregation bias. This is a general approximation of multiplier effects on the financial activities industry. For a more precise analysis of multiplier effects, analyze each six-digit NAICS category in the sector and its respective multipliers.
A direct effect is directly related to the production of the good or service of the industry in question. Indirect effects are generated in the businesses that supply goods and services to the industry that aid in the production of the good or service. Spending directly and indirectly generated incomes in the broader economy in turn creates induced effects.
Using the finance and insurance sector in an example, direct jobs would include the number of workers in finance and insurance. The jobs of a computer wholesaler that supplies the finance and insurance sector are indirect jobs. The jobs of restaurant workers that serve the finance and insurance and computer wholesaler workers lunch are induced.
- The Type 2 jobs multiplier effect mentioned is based solely on the number of jobs held by women.